A good friend of mine is writing a series of articles about the apparent dwindling affordability of housing in Austin, and asked me to research the values of all the homes she’s lived in over the last 30 years here. In lieu of that exercise, I test the data to see if Austin is really a less affordable place to live than in the 1990s for a typical Austinite. If you don’t like charts, skip to the tl;dr summary.
Who Lives in Austin?
While my friend has lived for three decades in Austin, she’s in the minority. Austin’s population typically doubles every 20 years. This chart shows how the population in Austin is changing by education level.
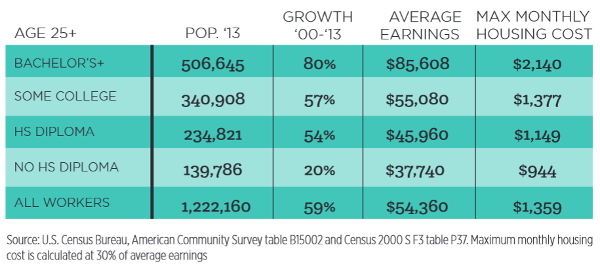
Source: Austin Realtor Magazine
The first chart covers a few things: people with higher education are coming to Austin. In the footnotes, it mentions the widely held metric that 30% of average earnings can be used for housing. (the FHA uses 31%, and there are other metrics but this is a good start)
The Austin population is expanding as fast as ever. The degree-wielding youth are the largest group, and you can see that Austin is especially popular with Millennials.

Source: Austin Realtor Magazine
How Much Do Austinites Earn?
The Department of Housing and Urban Development records the median family income in the area as $75,400, (4 person household) or $60,300 for a 2 person household. That’s in 2014. From the first chart, you can see that the influx of people comprises a larger proportion of higher earners.
Is Austin Real Estate Affordable?
What we’re looking at then is can 30% of a typical income can buy or rent you a place in Austin? I took a look at the Austin Board of Realtors statistics for March 2015, and threw in some assumptions about the current mortgage market.
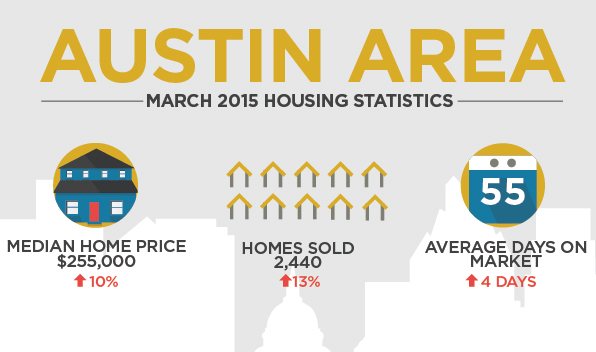
Source: Austin Board of Realtors
The first thing you can’t help notice is that more homes are selling, and the median price is higher than last year by ten percent. OK, I’m a real estate agent – of course I’m going to notice that. If you look in the detail of the ABoR report the leasing figures are in too:
“In March 2015, a total of 1,348 properties were leased in Austin, which is 12 percent more than March 2014. The median price for Austin-area home leases was $1,500, which is three percent more than the same month of the prior year.”
Doing a quick bit of loan math, the total monthly payment for the median Austin area home purchased with 10% down at 3.8% would be around $1,626 a month principal, interest, taxes and insurance (PITI).
The first chart tells us that 59% of the population have less than $1,400 to spend each month on housing.
So the results for the “median home in Austin” sold or leased in March 2015
- Not affordable to buy for 59% of the “all workers” in the first chart.
- Not affordable to lease for 59% of the “all workers” in the first chart.
Not everyone has $25,500 lying around in cash for a deposit for a purchase or a great credit rating, so there’s that too.
Now you might think that if close to 50% of the Austin population could afford the median home, we’d be largely alright, but that doesn’t take into account the Lorenz Curve:
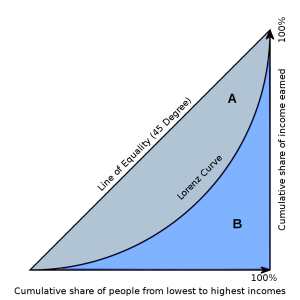
Sample Lorenz Curve, source: wikipedia
The Lorenz Curve describes a typical income distribution – so for example the lowest 20% of earners might only earn the lowest 10% of wages. In essence that means that our affordability problem is likely to be bigger than it might first appear. If you take a look at the Martin Prosperity Institute’s February 2015 report on the most economically segregated large metropolitan areas – Austin is top of that list.

Austin is most economically segregated. Source: Martin Prosperity Institute – click to see report
Has Austin’s Affordability Changed Over Time?
My loan to income analysis above covers just one point in time, so I looked at the National Association of Home Builders’ long term data set. In conjunction with Wells Fargo, they produce a Housing Opportunity Index (HOI). It’s a a measure of the percentage of homes sold in a given area that are affordable to families earning the area’s median income during a specific quarter.
They report on the Austin – Round Rock – San Marcos area and I was surprised by their results.
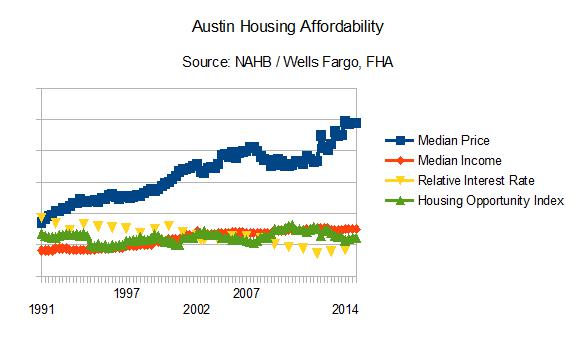
Relative Affordability in Austin since 1991
I charted them below against average 30 year fixed mortgage rates from the Federal Housing Authority. As you can see the median house price takes off in the last five years, and all the time the median income is rising (in part due to the change in distribution of earning adults in the very first chart) and mortgage rates are dropping. So overall, their measure of affordability – the HOI – is roughly the same as it was in the late 1990s, and Austin housing is more affordable that in the early 1990s.
I was surprised, so I took a look at their methodology. The difference between their approach and my one-off approach for March 2015 is that they assume buyers have a 20% down payment compared to my 10% assumption.
I Don’t Read Charts, Show Me Some Bullet Points
- Austin is as affordable as it was in the 1990s for the Austinite with median income
- Austin attracts high earners and college educated Millennials which have helped boost the median income.
- Austin is one of the most economically segregated city areas in the US and housing costs have increased rapidly in the last five years. Due to the income inequality, the rise in housing costs have a disproportion effect on those earning less than the median income.
What Can Be Done About Austin’s Affordability Crisis?
So what can be done about it?
Well we could instigate another housing crash but that would probably cause lots of headaches.
We could build more homes and offset the limited supply.
We could improve mass transit to support people who have been gentrified out of the urban core.
The City could ramp up its Affordable Housing schemes.
How would you like to see Austin change in the next ten years? Please comment below.
Here are a few links that might be of use:
- The team at Sherlock Homes Austin help people of all incomes find housing in Austin.
- If you’re worried about your property tax appraised value, you can use a Market Insider report to find out what’s happening to home prices in your neighborhood.
- You can learn more about the Affordable Housing program at their Mueller site, or call 512 215 4785.
1 Comment
An Austin Realtor · May 5, 2015 at 7:35 am
I had a question about how I calculated the monthly payment for the median family home, so I’ll break it down here:
median Austin purchase price: $255,000 per ABoR March 2015
90% loan of $229,500 at 3.8% over 30 years is a principle and interest payment of $1,069 monthly
assume property tax rate is 2.4% of $255,000, making $510 per month for property tax (probably less with exemptions)
Assume $560 per year for property insurance, or $47 per month.
That all adds up to $1,626 per month for the whole shebang.